The Last Two Percent
Hunting the network gremlins that break your SLA. The outages that cost you most fix themselves before anyone arrives, then come back next week. This paper shows how to find them in the alert history you already have, and how Rapax 2.0 tells you when the next one is due.
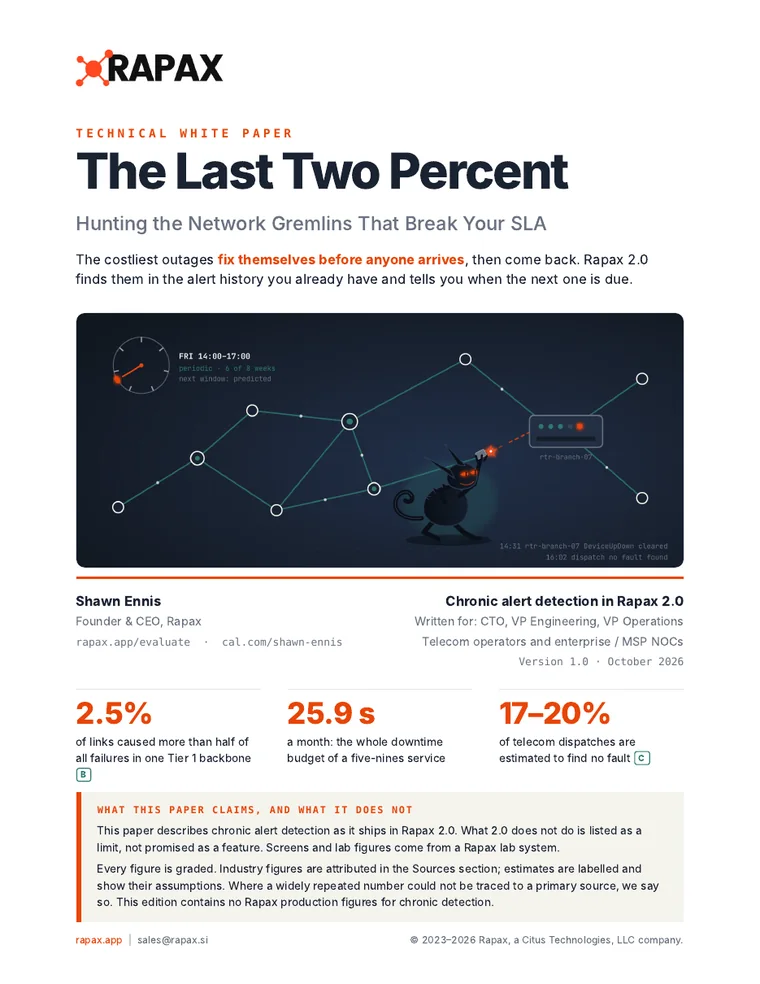
Most outages are easy to see. The expensive ones come and go.
A fiber cut or a failed power supply gets an alarm, a ticket and a fix. A router that drops for half an hour most Friday afternoons gets a truck that arrives after it has recovered, a part swapped on a hunch, and a customer counting credits.
Calling chronic outages “noise” is a recipe for SLA violations, a low-quality network and upset customers.
Noise reduction is built to make self-clearing alerts disappear, and a self-clearing alert that keeps coming back is exactly what a gremlin looks like. In 2014 one of them cost a Tier 1 carrier months of dispatches. The cause was a cleaning crew unplugging a router to vacuum. The clue, a Friday-afternoon pattern, had been in the data all along.
Rapax 2.0 reads the alert history you already have.
Every five minutes, chronic detection looks back over 56 days of alerts in five steps. No new probes, no data-science project.

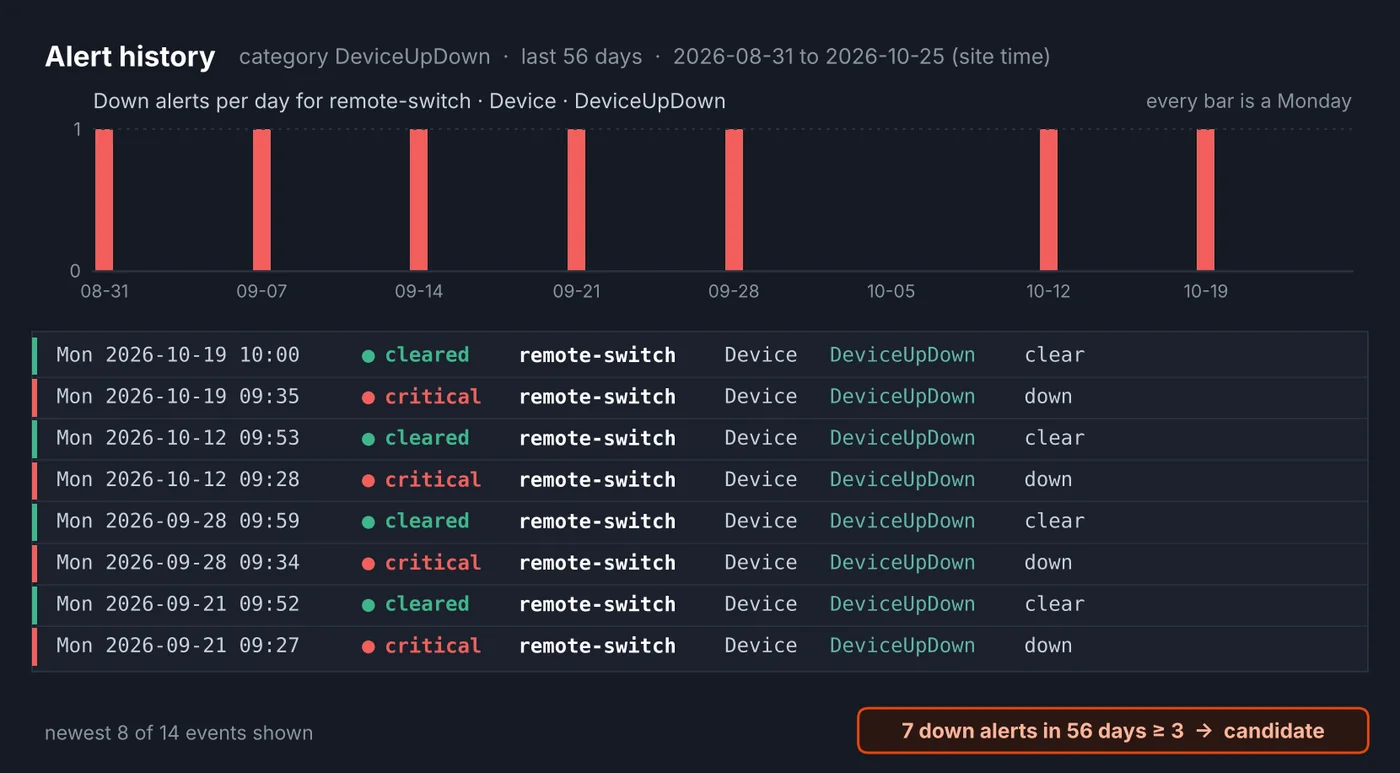
Find what keeps going down
Rapax counts down alerts per device, interface and alert category. Three or more in 56 days makes a candidate.
Alerts then become episodes: from the first down alert to the first clear, each with its start time and time to repair. A repeat before the clear stays one episode.
Three detectors, one pass
- Flapping: at least 4 episodes in 2 hours.
- Recurring: at least 3 episodes in 7 days, the same “X in Y days” shape as the chronic-circuit clauses in carrier contracts.
- Periodic: start times that cluster on a weekly or daily clock (Rayleigh test, p < 0.01, at least 4 episodes, hit rate of 60% or more).
A fault that strikes once a week never trips a count rule. That is what the periodic detector is for.
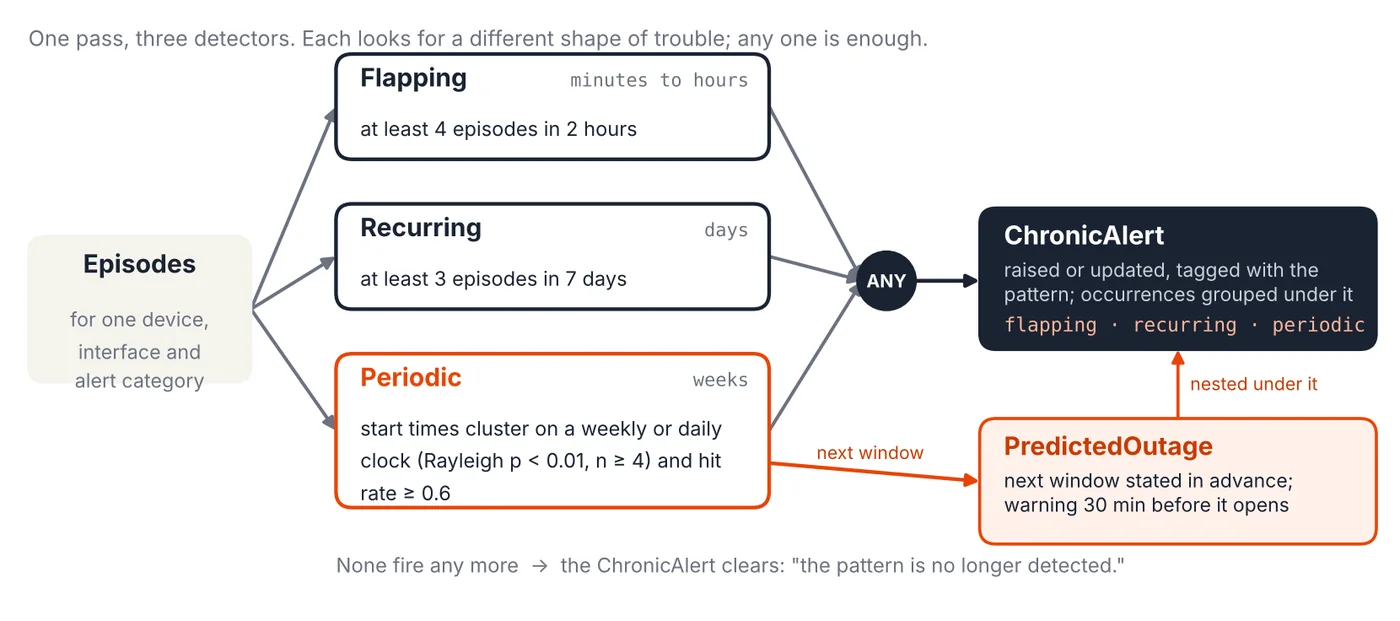
One ChronicAlert, and a warning before the next window
Every occurrence is grouped under one ChronicAlert, with total down time, mean time to repair and the last occurrence. It never overrides a real cause: if the site loses power, the power alert keeps the router.
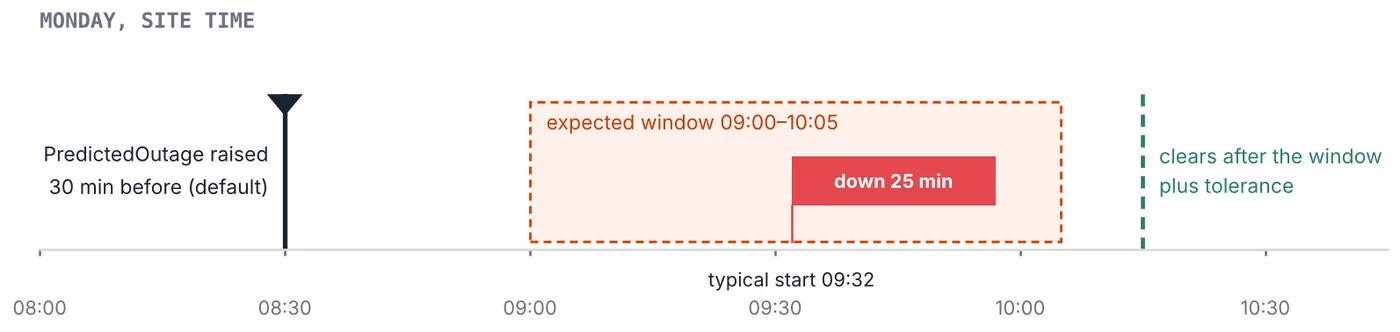
For a periodic pattern, Rapax states the next expected window days ahead and raises a PredictedOutage 30 minutes before it opens, so someone can be there when it happens. When the pattern stops, the ChronicAlert clears, which is evidence the fix worked.
The whole history in one place
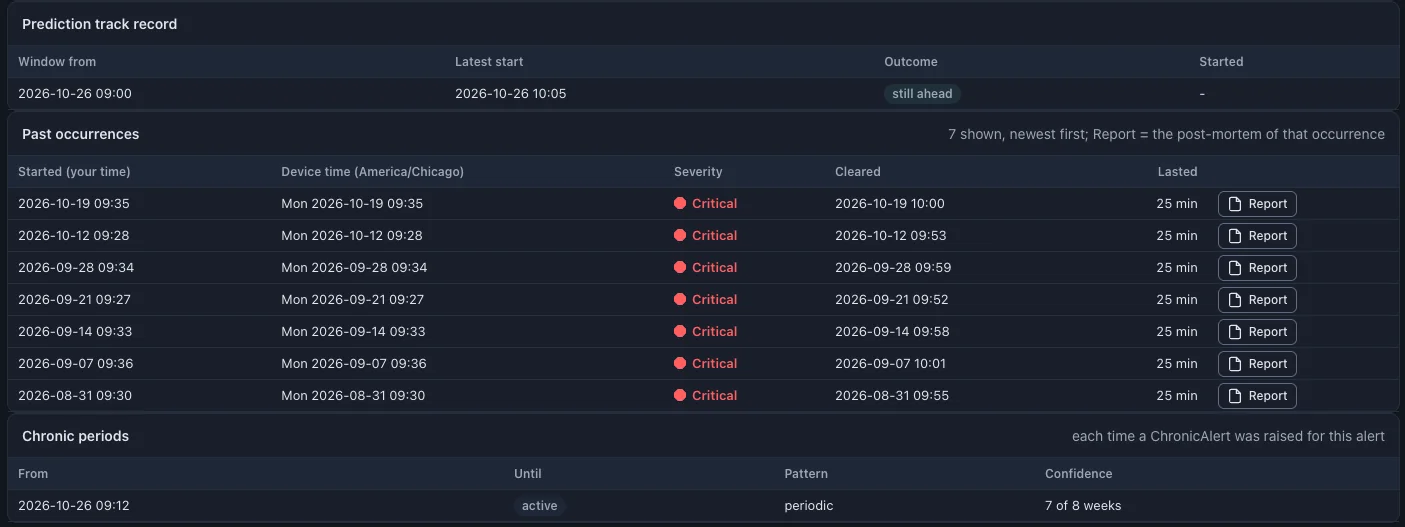
The chronic report keeps the prediction track record, every past occurrence with a link to its post-mortem, and each period the ChronicAlert was active. Post-mortems and the SLA view put the rest of the evidence a technician needs alongside it.
Screens are from a Rapax 2.0 lab system. This edition contains no production figures for chronic detection.
Twenty figures, twenty-three sources, and the limits.
A few links, most of the pain
What production-network studies say about how concentrated failures are, and why five nines leaves no room for a three-second flap.
What a gremlin really costs
Credits, chronic-circuit clauses, truck rolls, parts, engineering time and churn, in a model you can rerun with your own numbers.
How chronic detection works
The five-step cycle, the three detectors and the prediction, step by step with diagrams and lab screens.
Prepared, not surprised
How dispatch moves from chasing to scheduling, and what a technician gets when the pattern follows no clock.
Objections we hear
“Our AIOps already does this,” “probes give better data” and “a test on four points will cry wolf,” answered.
The math and the limits
The Rayleigh test and hit rate in an appendix, and a plain list of what Rapax 2.0 does not do yet.
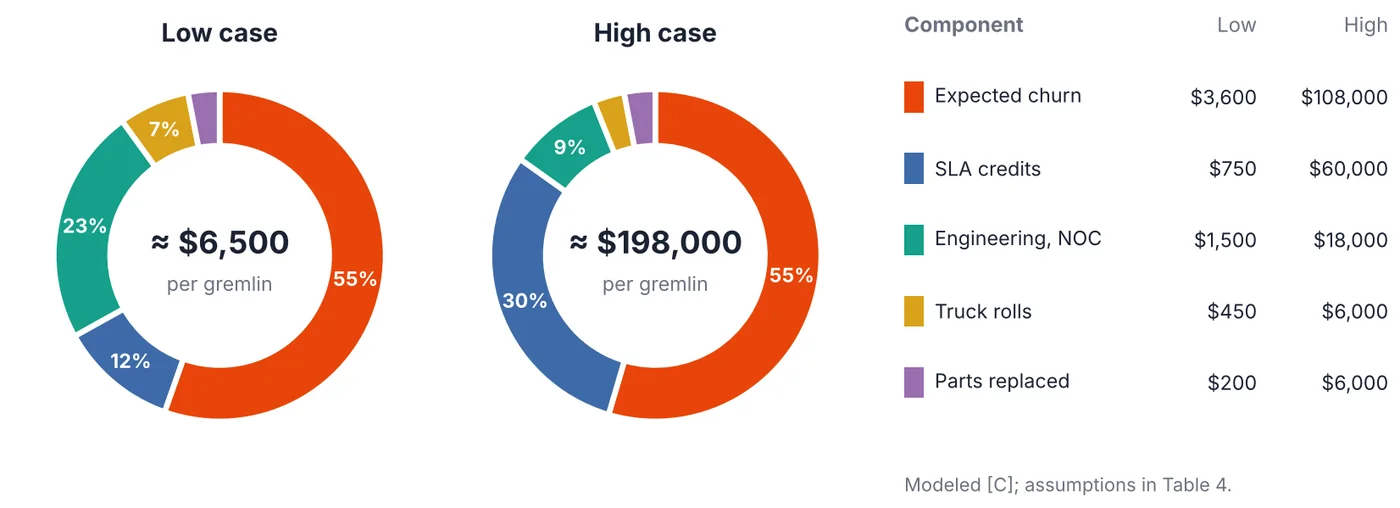
One gremlin: about $6,500 to $198,000 Modeled
The paper models what one gremlin costs an operator, from sourced ranges plus assumptions you can replace. Expected churn is the largest share at both ends; SLA credits are second in the high case.
We don’t quote a savings percentage. We would rather show you your own data.
Read the full paper.
Written by Shawn Ennis, Founder & CEO of Rapax, for CTOs, VPs of Engineering and VPs of Operations at telecom operators and enterprise and MSP NOCs.
- 24 pages, 20 figures, 23 sources
- Every statistic graded: B a named benchmark, C an estimate or model with its assumptions
- Diagrams and lab screens for every step
- What Rapax 2.0 does not do, listed as limits rather than promised as features
Get the PDF
Takes under a minute. The download opens on the next page.
How we handle your details: privacy policy.
Shawn Ennis, Founder & CEO, Rapax
Shawn has spent 25 years in telecom service assurance and network operations. He holds 12 patents in network management and service assurance and founded Assure1, acquired by Oracle in 2021. The Friday router in this paper was his problem in 2014.
- Turner et al., “California Fault Lines,” ACM SIGCOMM 2010, citing Markopoulou et al. on the Sprint backbone. Graded [B].
- 25.9 seconds: 30 days × 86,400 seconds × 0.001%.
- 17–20% no-fault-found dispatches: Firstsource and Asentria; commonly cited industry estimates, graded [C].
- Cost model: modeled in the paper, Section 9, graded [C]. The full source list is in the paper.
Find the gremlins in your network.
Run Rapax 2.0 free for 14 days, with a login to your own hosted system within two business days.
Request your free evaluationPrefer to talk first? Book 15 minutes or email sales@rapax.si.